
BEAM token’s trajectory, supported by moving averages and bullish chart patterns, suggests a breakout towards higher levels.
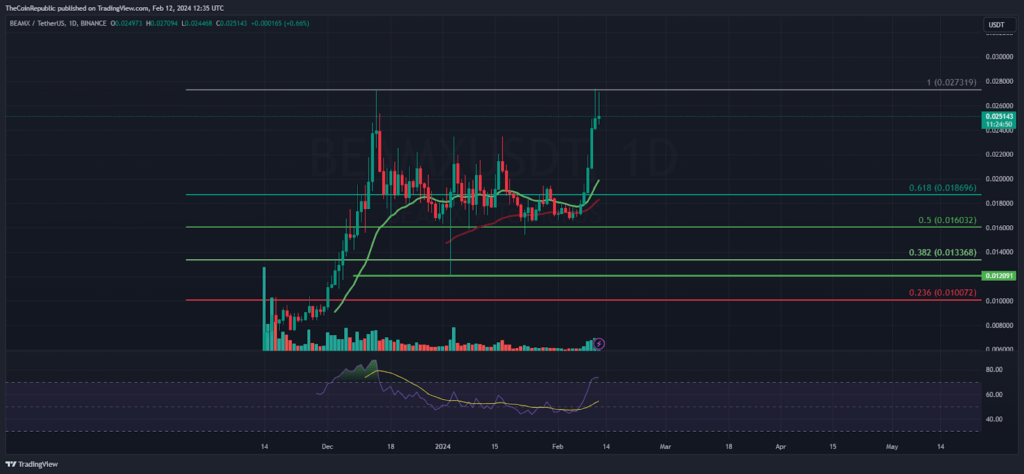
The price of BEAM token retested its all-time high of $0.02700, encountered resistance, and maintained its bullish trajectory, which reflected buying momentum on the charts.
Additionally, the token is ecstatic to have surpassed its ATH (all-time high) and is shortly targeting $0.03000. To obtain impetus, bulls are attempting to extend the upside beyond $0.02750 while maintaining a bullish appearance.
The token embodies a bullish sentiment and signifies the bulls’ preeminence.
The BEAM token has exhibited a consistent uptrend over the past few trading sessions and trades above the significant moving averages. Amidst benign market sentiments, the BEAM cryptocurrency continued and extended its ascent.
Moreover, purchasers remain enthusiastic about attaining the round figure of $0.03000 and carry on their accumulation.
As of press time, the cryptocurrency’s price was $0.02526, reflecting an intraday decline of 2.11%. The charts exhibited favorable sentiment. Moreover, the $76.12 million increase in trading volume, or 4.71 percent, indicates buying momentum.
The price of the BEAM/BTC pair is 0.000000528 BTC, with a market capitalization of $1.29 billion. Analysts are optimistic and predict that the cost of BEAM cryptocurrency (BEAM) will continue to rise and may soon surpass $0.02800.
Daily BEAM Token Charts Illustrate Buying Momentum
The token price has maintained its optimistic trajectory on daily charts and is approaching the upper Bollinger band. This indicates that a breakout is likely to occur in the subsequent sessions.
In recent sessions, the price action has exhibited a pullback from the 20-day moving average, which indicates a constructive posture.
Positive divergence on the Relative Strength Index (RSI) curve indicates that buying momentum will persist in the coming trading sessions. In contrast, the curve itself remains in the overbought region.
The MACD indicator exhibits a bullish crossover and green bar formation on the histogram, demonstrating the bulls’ predominance.
As per the Fib extension, should BEAM token manage to scrape off $0.02750, it could potentially advance to $0.02950 and subsequently settle at $0.03050.
The token displays a range-bound movement near the highs on the hourly charts and is awaiting the following sessions to break out to the upside of $0.02750.
The token, on the other hand, has retested its 20-day and 50-day EMAs and is imminently poised to reach a new high. The technicals indicate an upward trend for the forthcoming sessions by disclosing a bullish crossover.