
Crypto traders see similarities between Bitcoin’s current path and its behavior during the 2016 halving.
Crypto traders claim that Bitcoin is following the same trajectory as it did during the 2016 Bitcoin halving event, with one indicator suggesting it may be approaching its local bottom and another showing it reached $350,000 during “the peak” of this cycle.
Bitcoin History Repeats
Anonymous cryptocurrency trader Rekt Capital stated in a post on X on May 11 that “BTC has repeated 2016 history perfectly, offering a downside wick below the bottom of its current re-accumulation range within a three-week window after the halving.
According to CoinMarketCap data, Bitcoin is currently trading below $61,081, which is the range that Rekt predicts the re-accumulation range to be at this stage in the cycle.
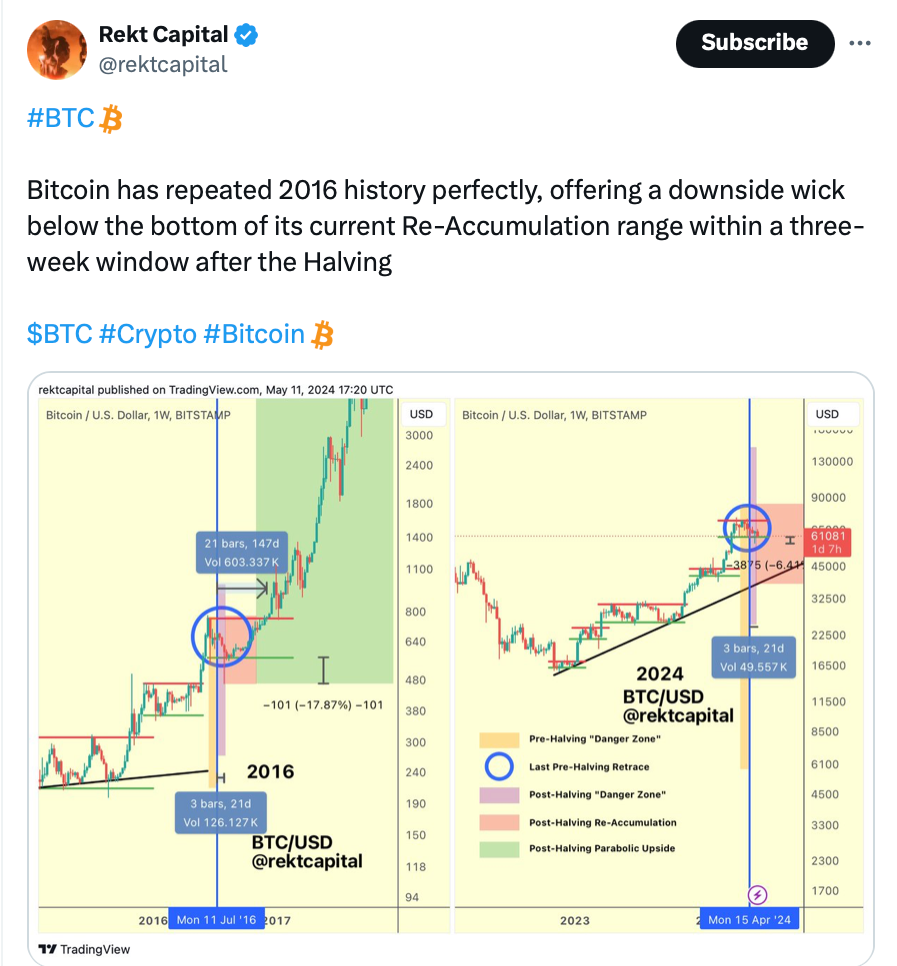
Rekt also pointed out that BTC is presently in the “last pre-halving retrace” stage, which experienced a 48% surge to $973 just six months after it passed in 2016.
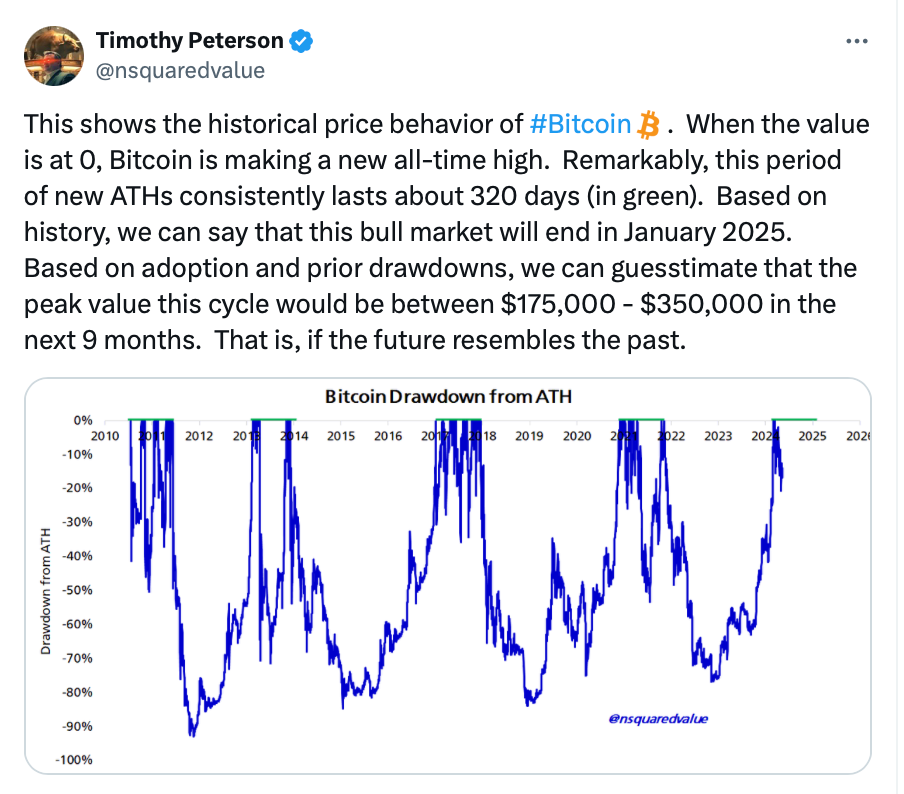
Timothy Peterson, the founder and investment manager of Cane Island Alternative Advisors, claims that the price drawdown from the all-time high (ATH) chart, which illustrates the drop from Bitcoin’s peak to its lowest position over a given time period, points to a far more ambitious price.
Peterson predicts that, based on the chart, the price of Bitcoin might almost double by the start of 2025.
We can estimate that the peak value of this cycle would be between $175,000 and $350,000 in the next 9 months based on adoption and prior drawdowns,” he wrote in a post on X on May 11.
History indicates that January 2025 will mark the end of this bull market,” Peterson continued.
According to anonymous cryptocurrency trader Daan Crypto traders, Bitcoin’s price may be “hovering around” its local bottom as indicated by the daily 100 moving average, a crucial technical indicator for forecasting long-term price trends.
We calculate the daily 100-day moving average by adding up the previous 100 days and dividing the total by 100.
In a post dated May 11, they compared the important zone to a similar formation that was observed following the approval of eleven spot Bitcoin exchange-traded funds (ETF) in January.
Its price increased by 32% to $51,730 on February 25, just one month later.”Support it until it isn’t; bulls need to put in some work,” they stated.