
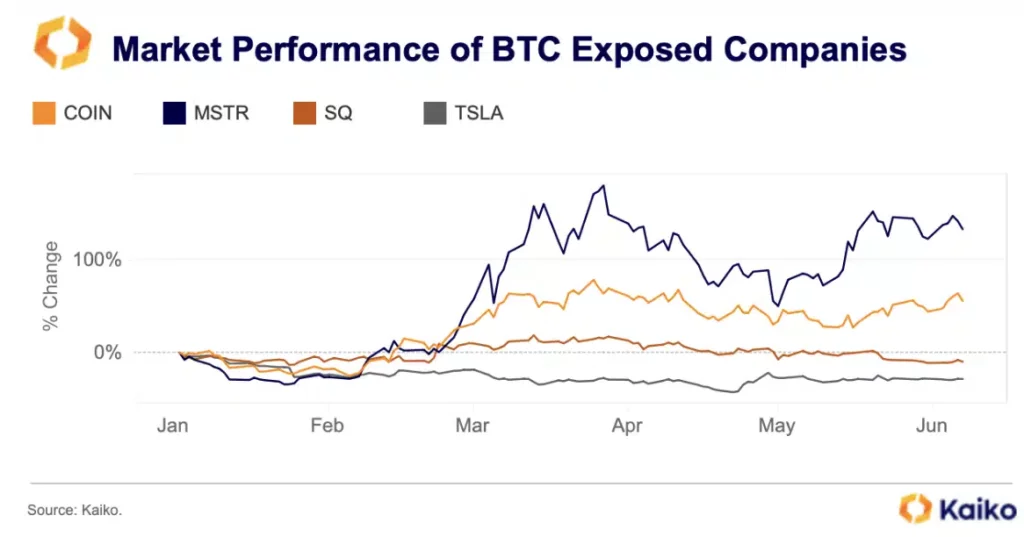
MicroStrategy’s stock has surged by 132%, outpacing Bitcoin itself, thanks to the launch of Bitcoin ETFs in the U.S.
In comparison to the performance of Bitcoin (BTC) and other firms that have invested in Bitcoin, such as Tesla and Block, the stock of MicroStrategy has climbed by an astounding 132%.
This is even greater than the performance of Bitcoin. MicroStrategy’s market capitalization has increased as a result of the debut of new Bitcoin spot exchange-traded funds (ETFs) in the United States has increased MicroStrategy’s market capitalization.
MicroStrategy Surges Amid Bitcoin ETF Adoption
These ETFs offer investors a direct option to participate in Bitcoin. The introduction of Bitcoin exchange-traded funds (ETFs) has increased adoption and institutional investments, contributing to the substantial growth of MicroStrategy.
Tesla and Block, on the other hand, have not been able to capitalize on these advances, as evidenced by the decline of their respective equities by 10% and 29%, respectively. This is because these companies move in tandem with the larger technology industry, which means that they have a low correlation with the price of Bitcoin.
This may be due to the fact that they move in tandem with the market. Metaplanet, a Japanese company, and Semler Scientific, a Japanese company, are two examples of new companies that have followed the trend of purchasing Bitcoin as an asset.
Immediately after the announcement, the stock of Metaplanet increased by 85%, while the stock of Semler increased by 10%. This shows that even enterprises can hold Bitcoin as a valuable asset on their balance sheets.
Despite these encouraging developments in the business world, the price of Bitcoin itself shows indications of a pessimistic trend in the market.
Bitcoin Sell-Off Intensifies, Prices Tumble
Over a twenty-four-hour period, a technical analysis revealed that the Relative Strength Index (RSI) has fallen below its signal line, indicating a potential escalation of the negative trend. The Moving Average Convergence Divergence (MACD), demonstrating a bearish crossover, supports this viewpoint.
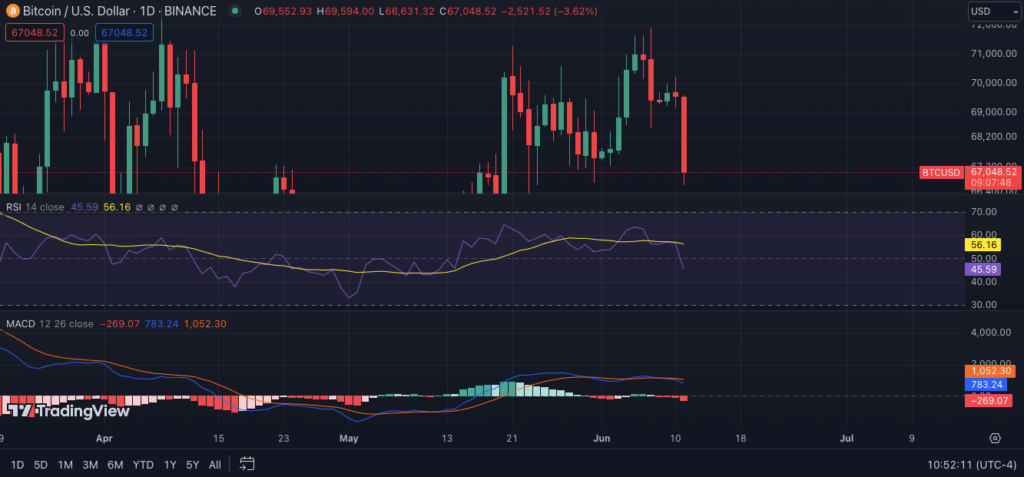
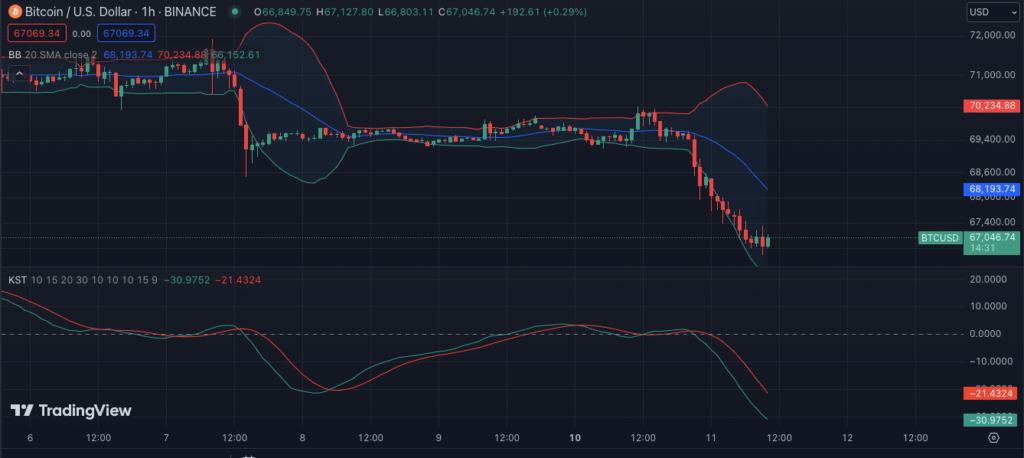
Furthermore, the trajectory histogram had a negative skew, indicating that additional drops may be on the horizon. On a more granular level, the Bitcoin price chart for one hour reveals a significant downward movement, with the Know Sure itself (KST) indicator falling into the negatives at -30,9752.
The price of Bitcoin has experienced a significant decline, plunging below the crucial support level of $68,000. The Bollinger Bands emphasize this volatility, with the price breaching the lower band around 14:00 UTC, a classic indication of an oversold state.
Individually and collectively, these indicators present a picture of increased selling pressure and a prevalent pessimistic mood among traders.