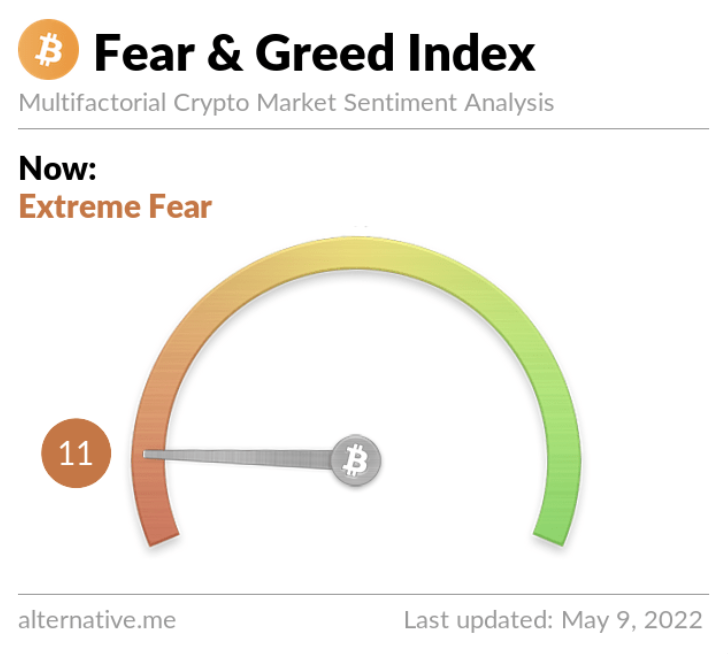
The Fear and Greed Index fell to 11 from 18 yesterday, indicating that many cryptocurrency investors are in extreme fear

Fear Is Dominating The Crypto Market
The Fear and Greed Index is a fairly accurate indicator of investor sentiment toward cryptocurrency at any given time.
The index fell to 11 today, almost as low as it has been in the past year, with 10 being the lowest value, as shown in the image and table below.

| LEVELS | RANGE | |
| Extreme Fear | Now | 11 |
| Extreme Fear | Yesterday | 18 |
| Fear | Last week | 28 |
| Fear | Last month | 30 |
So far, Bitcoin has dropped to roughly $33,300, and there doesn’t appear to be any support from here down to around 31k.
On the daily, the stochastic RSI has reached its bottom, and the Relative Strength Index is likely to enter oversold territory.
What Is The Fear And Greed Index?
CNNMoney made the fear and greed index to measure the two main feelings that affect how much investors are willing to pay for stocks: fear and greed.
The fear and greed index is tracked every day, every week, every month, and every year. In theory, the index can be used to figure out whether or not the prices on the stock market are fair.
This is because too much fear tends to make share prices go down, while too much greed tends to make share prices go up.
The CNN fear and greed index examines seven different factors to establish how much fear and greed there is in the market. They are:
- Stock Price Momentum – A measure of the Standard & Poor’s 500 Index (S&P 500) versus its 125-day moving average (MA).
- Price Strength – The number of stocks hitting 52-week highs versus those hitting 52-week lows on the New York Stock Exchange (NYSE).
- Stock Price Breadth – Analyzing the trading volumes in rising stocks against declining stocks.
- Put and Call Options – The extent to which put options lag behind call options, signifying greed, or surpassing them, indicating fear.
- Junk Bond Demand – Gauging appetite for higher risk strategies by measuring the spread between yields on investment-grade bonds and junk bonds.
- Market Volatility – CNN measures the Chicago Board Options Exchange Volatility Index (VIX) concentrating on a 50-day MA.
- Safe Haven Demand – The difference in returns for stocks versus treasuries.
Time To Buy?
Overall, a reversal could happen at any time, despite the Fear and Greed Index indication. Such a reversal is frequently triggered by a large bearish mood. It’s unclear if this will result in a total trend reversal or whether there will be a bounce followed by a lower high and then a continuation of the downward trend.
It might be a good moment to buy, based on the old proverb “Buy when there’s blood on the street.” In the current extremely negative atmosphere, the pavements may be considered to be flooded with it.
Investing in tiny amounts now could pay off big in the future. The fundamentals of bitcoin have remained unchanged, and given the state of fiat currencies, stocks, and bonds, it would not be surprising to see bitcoin rise to prominence and become a long-term store of value.
