Shiba Inu has been stuck in a sideways trading range beneath the $0.0000324 level but the price appears to be poised for incoming price movement

Shiba Inu (SHIB) Prepares For Price Breakout
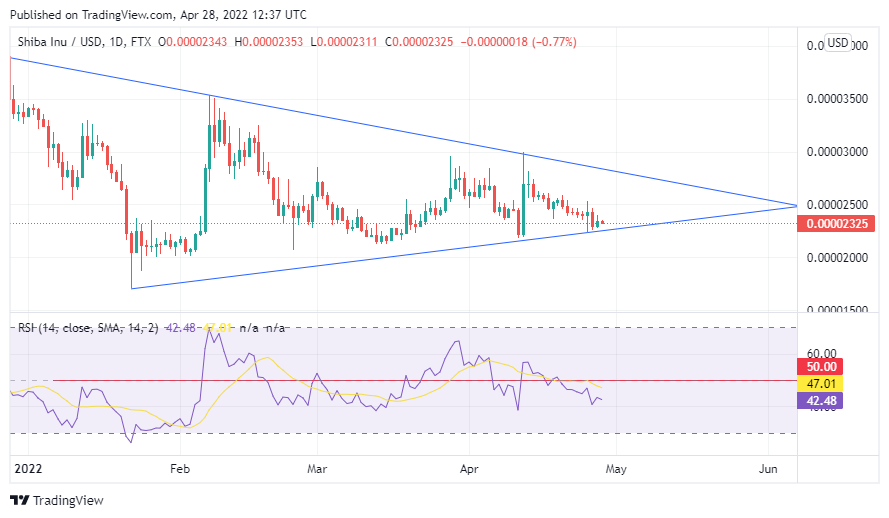
Since March, Shiba Inu has been stuck in a sideways trading range beneath the $0.0000324 level. SHIB daily charts have been consolidating inside a triangle pattern.
While the price appears to be poised for incoming price movement within the triangle formation, momentum indicators, particularly the RSI, are hovering around the neutral mark of 50.
This suggests that Shiba Inu may remain in a consolidation phase within the triangle for some time before a price breakout. After reaching all-time highs of $0.000088 in October 2021, the SHIB price stalled.
SHIB is currently trading at $0.0000233, down nearly 73.48 percent from its all-time high.

One of two things could happen in the future: a breakout above the current trading range could lead to an 18 percent run-up to recent highs of $0.0000353. Further gains could aim for targets of $0.0000543 and $0.000065.
A retest of the demand zone, on the other hand, could look for support between $0.000020 and $0.000017.
Indicators Reveal
IntoTheBlock’s net network growth indicator provides a view of both user engagement and growth. Shiba Inu ticks into negative territory in this regard. The SHIB holder count has dropped to 1,139,916 at press time, after peaking at 1,199,453 in mid-March.
The most recent price increase, in April, had no discernible effect on the number of holders. Whales are less active as a result, as evidenced by a 10% drop in active Shiba Inu whale addresses, according to WhaleStats.
Analysts frequently point out that a price increase combined with a decrease in network engagements or a decrease in network users could indicate something.
This could indicate that coin holders are unconcerned about rising prices and are not moving their coins. They “hodl” their assets as a result, reducing their activity. According to data from WhaleStats, Shiba Inu is the most popular token among the top ETH whales.
